Cost of electricity by source
From Wikipedia, the free encyclopedia
For the price of electricity, see Electricity pricing.

In electrical power generation, the distinct ways of generating electricity incur significantly different costs. Calculations of these costs at the point of connection to a load or to the electricity grid can be made. The cost is typically given per kilowatt-hour or megawatt-hour. It includes the initial capital, discount rate, as well as the costs of continuous operation, fuel, andmaintenance. This type of calculation assists policy makers, researchers and others to guide discussions and decision making.
The levelized cost of electricity (LCOE) is a measure of a power source which attempts to compare different methods of electricity generation on a comparable basis. It is an economic assessment of the average total cost to build and operate a power-generating asset over its lifetime divided by the total power output of the asset over that lifetime. The LCOE can also be regarded as the cost at which electricity must be generated in order to break-even over the lifetime of the project.
Contents
[show]Cost factors[edit]
While calculating costs, several internal cost factors have to be considered.[1] (Note the use of "costs," which is not the actual selling price, since this can be affected by a variety of factors such as subsidies and taxes):
- Capital costs (including waste disposal and decommissioning costs for nuclear energy) - tend to be low for fossil fuel power stations; high for wind turbines, solar PV; very high for waste to energy, wave and tidal, solar thermal, and nuclear.
- Fuel costs - high for fossil fuel and biomass sources, low for nuclear, and zero for many renewables.
- Factors such as the costs of waste (and associated issues) and different insurance costs are not included in the following: Works power, own use or parasitic load - that is, the portion of generated power actually used to run the stations pumps and fans has to be allowed for.
To evaluate the total cost of production of electricity, the streams of costs are converted to a net present value using the time value of money. These costs are all brought together using discounted cash flow.[2][3]
Levelized cost of electricity[edit]
The levelized cost of electricity (LCOE), also known as Levelized Energy Cost (LEC), is the net present value of the unit-cost of electricity over the lifetime of a generating asset. It is often taken as a proxy for the average price that the generating asset must receive in a market to break even over its lifetime. It is a first-order economic assessment of the cost competitiveness of an electricity-generating system that incorporates all costs over its lifetime: initial investment, operations and maintenance, cost of fuel, cost of capital.
The levelized cost is that value for which an equal-valued fixed revenue delivered over the life of the asset's generating profile would cause the project to break even. This can be roughly calculated as the net present value of all costs over the lifetime of the asset divided by the total electricity output of the asset.[4]
The levelized cost of electricity (LCOE) is given by:

It : investment expenditures in the year t Mt : operations and maintenance expenditures in the year t Ft : fuel expenditures in the year t Et : electricity generation in the year t r : discount rate n : expected lifetime of system or power station
- Note: Some caution must be taken when using formulas for the levelized cost, as they often embody unseen assumptions, neglect effects like taxes, and may be specified in real or nominal levelized cost. For example, other versions of the above formula do not discount the electricity stream.[citation needed]
Typically the LCOE is calculated over the design lifetime of a plant, which is usually 20 to 40 years, and given in the units of currency per kilowatt-hour or megawatt-day, for example AUD/kWh or EUR/kWh or per megawatt-hour, for example AUD/MWh (as tabulated below).[5] However, care should be taken in comparing different LCOE studies and the sources of the information as the LCOE for a given energy source is highly dependent on the assumptions, financing terms and technological deployment analyzed.[5] In particular, assumption of capacity factor has significant impact on the calculation of LCOE. Thus, a key requirement for the analysis is a clear statement of the applicability of the analysis based on justified assumptions.[5]
Many scholars,[specify] such as Paul Joskow, have described limits to the "levelized cost of electricity" metric for comparing new generating sources. In particular, LCOE ignores time effects associated with matching production to demand. This happens at two levels: (1) dispatchability, the ability of a generating system to come online, go offline, or ramp up or down, quickly as demand swings; and (2) the extent to which the availability profile matches or conflicts with the market demand profile. Thermally lethargic technologies like coal and nuclear are physically incapable of fast ramping. Capital intensive technologies such as wind, solar, and nuclear are economically disadvantaged unless generating at maximum availability since the LCOE is nearly all sunk-cost capital investment. Intermittent power sources, such as wind and solar, may incur extra costs associated with needing to have storage or backup generation available.[6] At the same time, intermittent sources can be competitive if they are available to produce when demand and prices are highest, such as solar during mid-day peaks seen in summertime load profiles.[5] Despite these time limitations, leveling costs is often a necessary prerequisite for making comparisons on an equal footing before demand profiles are considered, and the levelized-cost metric is widely used for comparing technologies at the margin, where grid implications of new generation can be neglected.
Avoided cost[edit]
The US Energy Information Administration has recommended that levelized costs of non-dispatchable sources such as wind or solar may be better compared to the avoided energy cost rather than to the LCOE of dispatchable sources such as fossil fuels or geothermal. This is because introduction of fluctuating power sources may or may not avoid capital and maintenance costs of backup dispatchable sources. Levelized Avoided Cost of Energy (LACE) is the avoided costs from other sources divided by the annual yearly output of the non-dispatchable source. However, the avoided cost is much harder to calculate accurately.[7][8]
Marginal cost of electricity[edit]
A more accurate economic assessment might be the marginal cost of electricity. This value works by comparing the added system cost of increasing electricity generation from one source versus that from other sources of electricity generation (see Merit Order).[citation needed]
External costs of energy sources[edit]
Typically pricing of electricity from various energy sources may not include all external costs - that is, the costs indirectly borne by society as a whole as a consequence of using that energy source.[9] These may include enabling costs, environmental impacts, usage lifespans, energy storage, recycling costs, or beyond-insurance accident effects.
The US Energy Information Administration predicts that coal and gas are set to be continually used to deliver the majority of the world's electricity,[10] this is expected to result in the evacuation of millions of homes in low lying areas, and an annual cost of hundreds of billions of dollars' worth of property damage.[11][12][13][14][15][16][17]
Furthermore, with a number of island nations becoming slowly submerged underwater due to rising sea levels,[18] massive international climate litigation lawsuits against fossil fuel users are currently[when?] beginning in the International Court of Justice.[19][20]
An EU funded research study known as ExternE, or Externalities of Energy, undertaken over the period of 1995 to 2005 found that the cost of producing electricity from coal or oil would double over its present value, and the cost of electricity production from gas would increase by 30% if external costs such as damage to the environment and to human health, from the particulate matter, nitrogen oxides, chromium VI, river water alkalinity, mercury poisoning and arsenic emissions produced by these sources, were taken into account. It was estimated in the study that these external, downstream, fossil fuel costs amount up to 1%-2% of the EU’s entire Gross Domestic Product (GDP), and this was before the external cost of global warming from these sources was even included.[21][22] Coal has the highest external cost in the EU, and global warming is the largest part of that cost.[9]
A means to address a part of the external costs of fossil fuel generation is carbon pricing — the method most favored by economics for reducing global-warming emissions. Carbon pricing charges those who emit carbon dioxide (CO2) for their emissions. That charge, called a 'carbon price', is the amount that must be paid for the right to emit one tonne of CO2 into the atmosphere.[23] Carbon pricing usually takes the form of a carbon tax or a requirement to purchase permits to emit (also called "allowances").
Depending on the assumptions of possible accidents and their probabilites external costs for nuclear power vary significantly and can reach between 0.2 to 200 ct/kWh.[24]Furthermore, nuclear power is working under an insurance framework that limits or structures accident liabilities in accordance with the Paris convention on nuclear third-party liability, the Brussels supplementary convention, and the Vienna convention on civil liability for nuclear damage[25] and in the U.S. the Price-Anderson Act. It is often argued that this potential shortfall in liability represents an external cost not included in the cost of nuclear electricity; but the cost is small, amounting to about 0.1% of the levelized cost of electricity, according to a CBO study.[26]
These beyond-insurance costs for worst-case scenarios are not unique to nuclear power, as hydroelectric power plants are similarly not fully insured against a catastrophic event such as the Banqiao Dam disaster, where 11 million people lost their homes and from 30,000 to 200,000 people died, or large dam failures in general. As private insurers base dam insurance premiums on limited scenarios, major disaster insurance in this sector is likewise provided by the state.[27]
Because externalities are diffuse in their effect, external costs can not be measured directly, but must be estimated. One approach estimate external costs of environmental impact of electricity is the Methodological Convention of Federal Environment Agency of Germany. That method arrives at external costs of electricity from lignite at 10.75 Eurocent/kWh, from hard coal 8.94 Eurocent/kWh, from natural gas 4.91 Eurocent/kWh, from photovoltaic 1.18 Eurocent/kWh, from wind 0.26 Eurocent/kWh and from hydro 0.18 Eurocent/kWh.[28] For nuclear the Federal Environment Agency indicates no value, as different studies have results that vary by a factor of 1,000. It recommends the nuclear given the huge uncertainty, with the cost of the next inferior energy source to evaluate.[29] Based on this recommendation the Federal Environment Agency, and with their own method, the Forum Ecological-social market economy, arrive at external environmental costs of nuclear energy at 10.7 to 34 ct/kWh.[30]
Additional cost factors[edit]
Calculations often do not include wider system costs associated with each type of plant, such as long distance transmission connections to grids, or balancing and reserve costs. Calculations do not include externalities such as health damage by coal plants, nor the effect of CO2 emissions on the climate change, ocean acidification and eutrophication,ocean current shifts. Decommissioning costs of nuclear plants are usually not included (The USA is an exception, because the cost of decommissioning is included in the price of electricity, per the Nuclear Waste Policy Act), is therefore not full cost accounting. These types of items can be explicitly added as necessary depending on the purpose of the calculation. It has little relation to actual price of power, but assists policy makers and others to guide discussions and decision making.[citation needed]
These are not minor factors but very significantly affect all responsible power decisions:
- Comparisons of life-cycle greenhouse gas emissions show coal, for instance, to be radically higher in terms of GHGs than any alternative. Accordingly, in the analysis below,carbon captured coal is generally treated as a separate source rather than being averaged in with other coal.
- Other environmental concerns with electricity generation include acid rain, ocean acidification and effect of coal extraction on watersheds.
- Various human health concerns with electricity generation, including asthma and smog, now dominate decisions in developed nations that incur health care costs publicly. AHarvard University Medical School study estimates the US health costs of coal alone at between 300 and 500 billion US dollars annually.[31]
- While cost per kWh of transmission varies drastically with distance, the long complex projects required to clear or even upgrade transmission routes make even attractive new supplies often uncompetitive with conservation measures (see below), because the timing of payoff must take the transmission upgrade into account.
Australia[edit]
| This section is outdated. (July 2015) |
The following table gives a selection of LCOE from two major government reports from Australia.[32][33] These figures do not include any cost for the greenhouse gas emissions (such as under carbon tax or emissions trading scenarios) associated with the different technologies. It should also be noted that the cost for wind and solar has dramatically reduced since 2006, for example, over the 5 years 2009-2014 solar costs fell by 75% making them comparable to coal, and are expected to continue dropping over the next 5 years by another 45% from 2014 prices.[34] Also, wind has been cheaper than coal since 2013, whereas coal and gas will only become less viable as subsidies may be withdrawn and there is the expectation that they will eventually have to pay the costs of pollution.
| Technology | Cost |
|---|---|
| Coal | 28–38 |
| Coal: IGCC + CCS | 53–98 |
| Coal: supercritical pulverized + CCS | 64–106 |
| Open-cycle Gas Turbine | 101 |
| Hot fractured rocks | 89 |
| Gas: combined cycle | 37–54 |
| Gas: combined cycle + CCS | 53–93 |
| Small Hydro power | 55 |
| Wind power: high capacity factor | 63 |
| Solar thermal | 85 |
| Biomass | 88 |
| Photovoltaics | 120 |
France[edit]
| This section is outdated. (July 2015) |
The International Agency for the Energy and EDF have estimated for 2011 the following costs. For the nuclear power they include the costs due to new safety investments to upgrade the French nuclear plant after the Fukushima Daiichi nuclear disaster; the cost for those investments is estimated at 4 €/MWh. Concerning the solar power the estimate at 293 €/MWh is for a large plant capable to produce in the range of 50–100 GWh/year located in a favorable location (such as in Southern Europe). For a small household plant capable to produce typically around 3 MWh/year the cost is according to the location between 400 and 700 €/MWh. Currently solar power is by far the most expensive renewable source to produce electricity, although increasing efficiency and longer lifespan of photovoltaic panels together with reduced production costs could make this source of energy more competitive.
| Technology | Cost in 2011 |
|---|---|
| Hydro power | 20 |
| Nuclear (with State-covered insurance costs) | 50 |
| Natural gas turbines without CO2 capture | 61 |
| Onshore wind | 69 |
| Solar farms | 293 |
Germany[edit]
In November 2013, the Fraunhofer Institute assessed the levelised generation costs for newly built power plants in the German electricity sector.[35] PV systems reached LCOE between 0.078 and 0.142 Euro/kWh in the third quarter of 2013, depending on the type of power plant (ground-mounted utility-scale or small rooftop solar PV) and average German insolation of 1000 to 1200 kWh/m² per year (GHI). There are no LCOE-figures available for electricity generated by recently built German nuclear power plants as none have been constructed since the late 1980s.
| Technology | Cost range in 2013 |
|---|---|
| Coal-fired power plants (brown coal) | 38–53 |
| Coal-fired power plant (hard coal) | 63–80 |
| CCGT power plants (cogeneration) | 75–98 |
| Onshore wind farms | 45–107 |
| Offshore wind power | 119–194 |
| PV systems | 78–142 |
| Biogas power plant | 135–250 |
| Source: Fraunhofer Institute- Levelized cost of electricity renewable energy technologies[35] | |
Japan[edit]
A 2010 study by the Japanese government (pre-Fukushima disaster), called the Energy White Paper, concluded the cost for kilowatt hour was ¥49 for solar, ¥10 to ¥14 for wind, and ¥5 or ¥6 for nuclear power. Masayoshi Son, an advocate for renewable energy, however, has pointed out that the government estimates for nuclear power did not include the costs for reprocessing the fuel or disaster insurance liability. Son estimated that if these costs were included, the cost of nuclear power was about the same as wind power.[36][37][38]
United Kingdom[edit]
The Institution of Engineers and Shipbuilders in Scotland commissioned a former Director of Operations of the British National Grid, Colin Gibson, to produce a report on generation levelised costs that for the first time would include some of the transmission costs as well as the generation costs. This was published in December 2011 and is available on the internet :.[39] The institution seeks to encourage debate of the issue, and has taken the unusual step among compilers of such studies of publishing a spreadsheet showing its data available on the internet :[40]
On 27 February 2015 Vattenfall Vindkraft AS agreed to build the Horns Rev 3 offshore wind farm at a price of 10.31 Eurocent per kWh. This has been quoted as below 100 UK pounds per MWh.
In 2013 in the United Kingdom for a new-to-build nuclear power plant (Hinkley Point C: completion 2023), a feed-in tariff of 92.50 pounds/MWh (around 142 USD/MWh) plus compensation for inflation with a running time of 35 years was agreed.[41][42]
DECC[edit]
| This section is outdated. (July 2015) |
More recent UK estimates are the Mott MacDonald study released by DECC in June 2010[43] and the Arup study for DECC published in 2011.[44]
| Technology | Cost range (£/MWh)[43] |
|---|---|
| Natural gas turbine, no CO2 capture | 55 – 110 |
| Natural gas turbines with CO2 capture | 60 – 130 |
| Biomass | 60 – 120 |
| New nuclear(a) | 80 – 105 |
| Onshore wind | 80 – 110 |
| Coal with CO2 capture | 100 – 155 |
| Offshore wind | 150 – 210 |
| Tidal power | 155 – 390 |
In March 2010, a new report on UK levelised generation costs was published by Parsons Brinckerhoff.[47] It puts a range on each cost due to various uncertainties. Combined cycle gas turbines without CO2 capture are not directly comparable to the other low carbon emission generation technologies in the BP study. The assumptions used in this study are given in the report.
United States[edit]
Energy Information Administration[edit]
The following data is from the Energy Information Administration's (EIA) Annual Energy Outlook released in 2015 (AEO2015). They are in dollars per megawatt-hour (2013 USD/MWh). These figures are estimates for plants going into service in 2020.[48] The LCOE below is calculated based off a 30-year recovery period using a real after tax weighted average cost of capital (WACC) of 6.1%. For carbon intensive technologies 3 percentage points are added to the WACC. (This is approximately equivalent fee of $15 per metric ton of carbon dioxide CO2)
Since 2010, the US Energy Information Administration (EIA) has published the Annual Energy Outlook (AEO), with yearly LCOE-projections for future utility-scale facilities to be commissioned in about five years' time. In 2015, EIA has been criticized by the Advanced Energy Economy (AEE) Institute after its release of the AEO 2015-report to "consistently underestimate the growth rate of renewable energy, leading to 'misperceptions' about the performance of these resources in the marketplace". AEE points out that the averagepower purchase agreement (PPA) for wind power was already at $24/MWh in 2013. Likewise, PPA agreements for utility-scale solar PV are seen at current levels of $50–$75/MWh.[49] These figures contrast strongly with EIA's estimated LCOE of $125/MWh (or $114/MWh including subsidies) for solar PV in 2020.[50]
| Power generating technology | Minimum | Average | Maximum |
|---|---|---|---|
| Conventional Coal | 87.1 | 95.1 | 119 |
| IGCC (Integrated Coal-Gasification Combined Cycle) | 106.1 | 115.7 | 136.1 |
| IGCC with CCS | 132.9 | 144.4 | 160.4 |
| Natural Gas-fired | na | na | na |
| NG: Conventional Combined Cycle | 70.4 | 75.2 | 85.5 |
| NG: Advanced Combined Cycle | 68.6 | 72.6 | 81.7 |
| NG: Advanced CC with CCS | 93.3 | 100.2 | 110.8 |
| NG: Conventional Combustion Turbine | 107.3 | 141.5 | 156.4 |
| NG: Advanced Combustion Turbine | 94.6 | 113.5 | 126.8 |
| Advanced Nuclear | 91.8 | 95.2 | 101 |
| Geothermal | 43.8 | 47.8 | 52.1 |
| Biomass | 90 | 100.5 | 117.4 |
| Wind onshore | 65.6 | 73.6 | 81.6 |
| Wind offshore | 169.5 | 196.9 | 269.8 |
| Solar PV | 97.8 | 125.3 | 193.3 |
| Solar Thermal | 174.4 | 239.7 | 382.5 |
| Hydro | 69.3 | 83.5 | 107.2 |
The electricity sources which had the most decrease in estimated costs over the period 2010 to 2015 were solar photovoltaic (down 68%), onshore wind (down 51%) and advanced nuclear (down 20%).
For utility-scale generation put into service in 2040, the EIA estimated in 2015 that there would be further reductions in the constant-dollar cost of solar thermal (down 18%), solar photovoltaic (down 15%), offshore wind (down 11%), and advanced nuclear (down 7%). The cost of onshore wind was expected to rise slightly (up 2%) by 2040, while natural gas combined cycle electricity was expected to increase 9% to 10% over the period.[50]
| Estimate in $/MWh | Coal convent'l | NG combined cycle | Nuclear advanced | Wind | Solar | |||||
|---|---|---|---|---|---|---|---|---|---|---|
| of year | ref | for year | convent'l | advanced | onshore | offshore | PV | CSP | ||
| 2010 | [51] | 2016 | 100.4 | 83.1 | 79.3 | 119.0 | 149.3 | 191.1 | 396.1 | 256.6 |
| 2011 | [52] | 2016 | 95.1 | 65.1 | 62.2 | 114.0 | 96.1 | 243.7 | 211.0 | 312.2 |
| 2012 | [53] | 2017 | 97.7 | 66.1 | 63.1 | 111.4 | 96.0 | n.a. | 152.4 | 242.0 |
| 2013 | [54] | 2018 | 100.1 | 67.1 | 65.6 | 108.4 | 86.6 | 221.5 | 144.3 | 261.5 |
| 2014 | [55] | 2019 | 95.6 | 66.3 | 64.4 | 96.1 | 80.3 | 204.1 | 130.0 | 243.1 |
| 2015 | [50] | 2020 | 95.1 | 75.2 | 72.6 | 95.2 | 73.6 | 196.9 | 125.3 | 239.7 |
| Nominal change 2010-2015 | - 5% | - 8% | - 10% | - 20% | - 51% | + 3% | - 68% | - 7% | ||
| Note: Projected LCOE are adjusted for inflation and calculated on constant dollars based on two years prior to the release year of the estimate. Estimates given without any subsidies. Transmission cost for non-dispatchable sources are on average much higher. | ||||||||||
NREL OpenEI (2014)[edit]
OpenEI, sponsored jointly by the US DOE and the National Renewable Energy Laboratory (NREL), has compiled a historical cost-of-generation database[56] covering a wide variety of generation sources. Because the data is open source it may be subject to frequent revision.
| Plant Type (USD/MWh) | Max | Median | Min |
|---|---|---|---|
| Wind, onshore | 80 | 40 | |
| Wind, offshore | 200 | 100 | |
| Solar PV | 250 | 110 | 60 |
| Solar CSP | 220 | 100 | |
| Geothermal Hydrothermal&& | 100 | 50 | |
| Blind Geothermal&& | 100 | ||
| Enhanced Geothermal | 130 | 80 | |
| Small Hydropower&& | 140 | ||
| Hydropower&& | 100 | 70 | 30 |
| Ocean&& | 250 | 240 | 230 |
| Biopower | 110 | 90 | |
| Distributed Generation | 130 | 70 | 10 |
| Fuel Cell | 160 | 100 | |
| Natural Gas Combined Cycle | 80 | 50 | |
| Natural Gas Combustion Turbine | 200 | 140 | |
| Coal, pulverized, scrubbed | 150 | 60 | |
| Coal, pulverized, unscrubbed^^ | 40 | ||
| Coal, integrated gasification, combined cycle | 170 | 100 | |
| Nuclear | 130 | 90 |
&& = Data from 2011
^^ = Data from 2008
All other Data from 2014
Only Median value = only one data point.
Only Max + Min value = Only two data points.
^^ = Data from 2008
All other Data from 2014
Only Median value = only one data point.
Only Max + Min value = Only two data points.
California Energy Commission (2007)[edit]
| This section is outdated. (July 2015) |
A draft report of LECs used by the California Energy Commission is available.[57] From this report, the price per MWh for a municipal energy source is shown here:
| Technology | Cost (US$/MWh) |
|---|---|
| Advanced Nuclear | 67 |
| Coal | 74–88 |
| Gas | 87–346 |
| Geothermal | 67 |
| Hydro power | 48–86 |
| Wind power | 60 |
| Solar | 116–312 |
| Biomass | 47–117 |
| Fuel Cell | 86–111 |
| Wave Power | 611 |
| Note that the above figures incorporate tax breaks for the various forms of power plants. Subsidies range from 0% (for Coal) to 14% (for nuclear) to over 100% (for solar). | |
Lazard (2014)[edit]
In the summer of 2014, the investment bank Lazard has published headquartered in New York, a study on the current electricity production costs of photovoltaics in the US compared to conventional power generators. The best large-scale photovoltaic power plants can produce electricity at 60 USD per MWh. The average value of such large power plants is currently at 72 USD per MWh and the upper limit at 86 USD per MWh. In comparison, coal-fired plants are between 66 USD and $151 per MWh, nuclear power at 124 USD per MWh. Small photovoltaic power plants on roofs of houses are still at 126-265 USD per MWh, but which can do without electricity transport costs. Onshore wind turbines are 37-81 USD per MWh. One drawback see the electricity supplier of the study by the volatility of solar and wind power. One solution provides the study in batteries as a storage, but are still expensive so far.[58][59]
Below is the complete list of LCOEs by source from the investment bank Lazard.[58]
| Plant Type ( USD/MWh) | Low | High |
|---|---|---|
| Solar PV-Rooftop Residential | 180 | 265 |
| Solar PV-Rooftop C&I | 126 | 177 |
| Solar PV-Crystalline Utility Scale | 72 | 86 |
| Solar PV-Thin Film Utility Scale | 72 | 86 |
| Solar Thermal with Storage | 118 | 130 |
| Fuel Cell | 115 | 176 |
| Microturbine | 102 | 135 |
| Geothermal | 89 | 142 |
| Biomass Direct | 87 | 116 |
| Wind | 37 | 81 |
| Energy Efficiency | 0 | 50 |
| Battery Storage | 265 | 324 |
| Diesel Generator | 297 | 332 |
| Gas Peaking | 179 | 230 |
| IGCC | 102 | 171 |
| Nuclear | 92 | 132 |
| Coal | 66 | 151 |
| Gas Combined Cycle | 61 | 87 |
In a power purchase agreement in the United States in July 2015 for a period of 20 years of solar power will be paid 3.87 UScent per kilowatt hour (38.7 USD/MWh). The solar system, which produces this solar power, is in Nevada (USA) and has 100 MW capacity.[60]
Other studies and analysis[edit]
Nuclear Energy Agency (2012)[edit]
In November 2012, the OECD Nuclear Energy Agency published a report with the title System effects in low carbon energy systems.[61] In this report NEA looks at the interactions of dispatchable energy technologies (fossil and nuclear) and variable renewables (solar and wind) in terms of their effects on electricity systems. These grid-level systems costsdiffer from the levelized cost of electricity metric that scholars like Paul Joskow have criticised as incomplete, as they also include costs related to the electricity grid, such as extending and reinforcing transport and distribution grids, connecting new capacity to the grid, and the additional costs of providing back-up capacity for balancing the grid. NEA calculated these costs for a number of OECD countries with different levels of penetration for each energy source.[61] This report has been criticized for its adequacy and used methodology.[62][63] Swedish KTH in Stockholm published a report in response, finding "several question marks concerning the calculation methods".[64]:5 While the grid-level systems costs in the 2012 OECD-NEA report is calculated to be $17.70 per MWh for 10% onshore wind in Finland, the Swedish Royal Institute of Technology concludes in their analysis, that these costs are rather $0 to $3.70 per MWh (or 79% to 100% less than NEA's calculations), as they are either much smaller or already included in the market.[64]:23–24
| Technology | Nuclear | Coal | Gas | Onshore Wind | Offshore Wind | Solar | ||||||
|---|---|---|---|---|---|---|---|---|---|---|---|---|
| Penetration Level | 10% | 30% | 10% | 30% | 10% | 30% | 10% | 30% | 10% | 30% | 10% | 30% |
| Backup costs (adequacy) | 0.00 | 0.00 | 0.04 | 0.04 | 0.00 | 0.00 | 5.61 | 6.14 | 2.10 | 6.85 | 0.00 | 10.45 |
| Balancing costs | 0.16 | 0.10 | 0.00 | 0.00 | 0.00 | 0.00 | 2.00 | 5.00 | 2.00 | 5.00 | 2.00 | 5.00 |
| Grid connection | 1.56 | 1.56 | 1.03 | 1.03 | 0.51 | 0.51 | 6.50 | 6.50 | 15.24 | 15.24 | 10.05 | 10.05 |
| Grid reinforcement & extension | 0.00 | 0.00 | 0.00 | 0.00 | 0.00 | 0.00 | 2.20 | 2.20 | 1.18 | 1.18 | 2.77 | 2.77 |
| Total Grid-level System Costs | 1.72 | 1.67 | 1.07 | 1.07 | 0.51 | 0.51 | 16.30 | 19.84 | 20.51 | 28.26 | 14.82 | 28.27 |
Brookings Institution (2014)[edit]
In 2014, the Brookings Institution published The Net Benefits of Low and No-Carbon Electricity Technologies which states, after performing an energy and emissions cost analysis, that "The net benefits of new nuclear, hydro, and natural gas combined cycle plants far outweigh the net benefits of new wind or solar plants", with the most cost effective low carbon power technology being determined to be nuclear power.[65][66]
Comparison different studies (2004–2009)[edit]
Several studies compared the levelized cost of nuclear and fossil power generation. These include studies from the Royal Academy of Engineering (UK 2004), University of Chicago (US 2004), Canadian Energy Research Institute (CAN 2004), the United Kingdom Department of Trade and Industry (UK 2006), the European Commission (BEL 2008), the House of the Lords, Select Committee on Economic Affairs (UK 2008) and MIT (US 2009).

Analysis from different sources (2009)[edit]
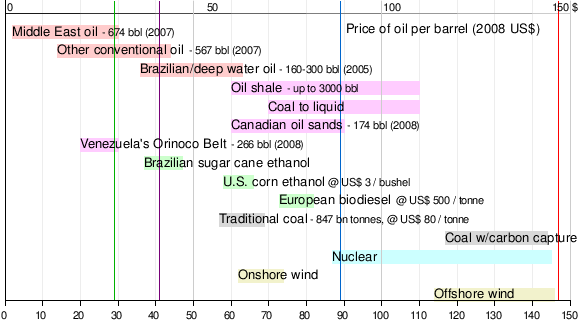
| █ Conventional oil | █ Unconventional oil | █ Biofuels | █ Coal | █ Nuclear | █ Wind |
| Colored vertical lines indicate various historical oil prices. From left to right: | |||||
| — 1990s average | — January 2009 | — 1979 peak | — 2008 peak | ||
Price of oil per barrel (bbl) at which energy sources are competitive.
- Right end of bar is viability without subsidy.
- Left end of bar requires regulation or government subsidies.
- Wider bars indicate uncertainty.
Renewables[edit]
Photovoltaics[edit]


Photovoltaic prices have fallen from $76.67 per watt in 1977 to an estimated $0.30 per watt in 2015, for crystalline silicon solar cells.[68][69]This is seen as evidence supporting Swanson's law, an observation similar to the famous Moore's Law, that states that solar cell prices fall 20% for every doubling of industry capacity.
By 2011, the price of PV modules per MW had fallen by 60% since 2008, according to Bloomberg New Energy Finance estimates, putting solar power for the first time on a competitive footing with the retail price of electricity in some sunny countries; an alternative and consistent price decline figure of 75% from 2007 to 2012 has also been published,[70] though it is unclear whether these figures are specific to the United States or generally global. The levelised cost of electricity (LCOE) from PV is competitive with conventional electricity sources in an expanding list of geographic regions,[5] particularly when the time of generation is included, as electricity is worth more during the day than at night.[71] There has been fierce competition in the supply chain, and further improvements in the levelised cost of energy for solar lie ahead, posing a growing threat to the dominance of fossil fuel generation sources in the next few years.[72] As time progresses, renewable energy technologies generally get cheaper,[73][74] while fossil fuels generally get more expensive:
In the year 2015, First Solar agreed to supply solar power at 3.87 cents/kWh levelised price from its 100 MW Playa Solar 2 project which is far cheaper than the electricity sale price from conventional electricity generation plants.[76]
It is now evident that, given a carbon price of $50/ton, which would raise the price of coal-fired power by 5c/kWh, solar PV, Wind, and Nuclear will be cost-competitive in most locations. The declining price of PV has been reflected in rapidly growing installations, totalling about 23 GW in 2011. Although some consolidation is likely in 2012, due to support cuts in the large markets of Germany and Italy, strong growth seems likely to continue for the rest of the decade. Already, by one estimate, total investment in renewables for 2011 exceeded investment in carbon-based electricity generation.[77]
In the case of self consumption, payback time is calculated based on how much electricity is not brought from the grid. Additionally, using PV solar power to charge DC batteries, as used in Plug-in Hybrid Electric Vehicles and Electric Vehicles, leads to greater efficiencies, but higher costs. Traditionally, DC generated electricity from solar PV must be converted to AC for buildings, at an average 10% loss during the conversion. Inverter technology is rapidly improving and current equipment have reached over 96% efficiency for small scale residential, while commercial scale three-phase equipment can reach well above 98% efficiency. However, an additional efficiency loss occurs in the transition back to DC for battery driven devices and vehicles, and using various interest rates and energy price changes were calculated to find present values that range from $2,057.13 to $8,213.64 (analysis from 2009).[78]
Wind power[edit]


In 2004, wind energy cost a fifth of what it did in the 1980s, and some expected that downward trend to continue as larger multi-megawatt turbines were mass-produced.[80] As of 2012 capital costs for wind turbines are substantially lower than 2008–2010 but are still above 2002 levels.[81] A 2011 report from the American Wind Energy Association stated, "Wind's costs have dropped over the past two years, in the range of 5 to 6 cents per kilowatt-hour recently.... about 2 cents cheaper than coal-fired electricity, and more projects were financed through debt arrangements than tax equity structures last year.... winning more mainstream acceptance from Wall Street's banks.... Equipment makers can also deliver products in the same year that they are ordered instead of waiting up to three years as was the case in previous cycles.... 5,600 MW of new installed capacity is under construction in the United States, more than double the number at this point in 2010. Thirty-five percent of all new power generation built in the United States since 2005 has come from wind, more than new gas and coal plants combined, as power providers are increasingly enticed to wind as a convenient hedge against unpredictable commodity price moves."[82]
This cost has additionally reduced as wind turbine technology has improved. There are now longer and lighter wind turbine blades, improvements in turbine performance and increased power generation efficiency. Also, wind project capital and maintenance costs have continued to decline.[83] For example, the wind industry in the USA is now[when?] able to produce more power at lower cost by using taller wind turbines with longer blades, capturing the faster winds at higher elevations. This has opened up new opportunities and in Indiana, Michigan, and Ohio. The price of power from wind turbines built 300 feet to 400 feet above the ground can now compete with conventional fossil fuels like coal. Prices have fallen to about 4 cents per kilowatt-hour in some cases and utilities have been increasing the amount of wind energy in their portfolio, saying it is their cheapest option.[84]


0 comments:
Post a Comment